Analysis of Pellucid’s Article & Responses
The analysis attempted to use an allocated cost per round of golf as a way of assessing the cost of barter. The resulting calculations imply that the bartering option is by far the most expensive and implies golf courses should avoid this model.
On April 14, 2006, the author of the article responded to Cypress Golf Solutions’ e-mails disputing the findings. In his e-mail, the author develops new calculations from a profitability perspective which claim to validate his calculations in the article. They use revenue from the golf course net total operating expenses and result in lower profitability for both barter scenarios he uses. Again, his implication is that bartering is less profitable for the golf course and should be avoided.
In summary, the author's assertions are based on one dubious assumption: that all courses sell a set percentage of their available inventory. However, he redefines the available inventory for those courses participating in a barter system and applies the fixed sale percentage. In order to accept this assumption, the author would have to produce evidence that courses participating in a barter system sell fewer rounds of golf than other courses. He does not present any evidence to indicate this.
In addition, the author uses a flawed cost allocation model as a way of backing up his assertions. We explain why this cost allocation model is not mirrored in other similar industries and why this model would lead to bad long-term pricing decisions.
Finally, we present analysis that indicates the opposite of the author's assertions. Courses participating in a barter business model are more profitable under the author's assumptions, especially in the case where they are interfaced. In the case where they are not interfaced, we present a decision threshold for choosing which tee times to barter in order to be confident they are achieving better profitability than their counterpart courses.
Analysis
The article published on April 3 has several accounting and mathematical flaws that skew the results of the calculations. In addition, the response from the author on April 14 contains another accounting flaw in an attempt to calculate a full-profitability analysis of the three options. We will address those flaws and propose more accurate calculations on a number of topics:
- Cost allocations for “spoilage inventory”
- Profitability analysis for the three business model scenarios
- Faulty application of statistics in the second barter calculation
- Faulty profitability analysis in the April 14th e-mail
Cost Allocations for “Spoilage Inventory”
In the newsletter article, the author uses a simple cost-allocation formula to estimate the cost per round of golf to the course. His formula is:
- Cost Per Round = Operating Expenses / Weather Adjusted Capacity
However, since this is time-sensitive inventory which will “spoil” if not used in time, it would be more appropriate to calculate the cost per round based, not on the weather-adjusted capacity, but on the entire capacity. Essentially, weather-adjusted capacity omits “spoiled inventory” as well. Thus, the author chooses to ignore one type of spoiled inventory, but does not discount unsold rounds, or rounds that will go unsold eventually, as spoiled inventory as well. Thus he overstates the cost per round.
In order to establish a true cost per round, one must either use all capacity or divide by unspoiled inventory, which would exclude rounds that will go unsold.
Other businesses with time-dependent inventory tend not to use this cost allocation method. For example, in the airline industry where the inventory is time-dependent as well, if they were to use this profitability metric, they would make very different business decisions than they do now.
Imagine a flight with 150 seats costs $30,000 to fly. The cost allocation method would mean that each seat costs the airline $200. If the day of the flight, the airplane is only 85% occupied, that would mean the airline would have 30 unsold seats and about to incur a loss of $6000. In order to avoid this loss, at the last minute, the airline would sell last-minute seats for $200 plus a very small margin to not incur this loss. As we all know, airlines do not do this. In fact, once the airline is leaving “profitably”, the airline will sell last-minute seats at a premium to accommodate low-price sensitivity demand. They will do this even if it means that several seats will remain empty.
In fact, quite to the contrary, when it becomes obvious that these seats will remain empty, airlines often comp these seats to airline employees or accommodate stand-by passengers. They certainly do not incur a $200 per seat loss for these non-revenue passengers. They calculate their profitability based on the sold seats for the flight and make sure that they cover the $30,000 operating expense for the day. They justify the non-revenue use of seats which would not have sold anyways, assuming the relative cost base of the seat is zero. They certainly do not book this as a cost.
Airlines make these decisions based on their ability to maximize their profit for the flight. In some cases, lowering all prices in order to sell out every seat is not as profitable as charging a higher price and leaving some seats unsold. This results in more total profit for the airline. They would never be able to achieve these results if they used the cost-allocation method proposed by the author.
It is clear that in the hotel and airline industries, which also have time-sensitive inventory, do not operate their businesses using this cost-allocation model. Golf courses should take the lead of the travel industry and calculate their profitability based on the total capacity during the day, not for each round – or “seat”, if you will.
The author's approach ignores the simple fact that if the golf course maximizes its profit during a day, they may in fact leave holes unsold. His method simply “pushes peas around on the plate” – creating losses for unsold holes and overstating profitability for the sold ones. This method is misleading and doesn’t allow the cost structure necessary to achieve maximum profitability. A better approach would be a full profitability analysis of the course on a particular day.
Profitability Analysis for the Three Business Models
We will take the approach of analyzing the profitability of the course on a particular day, after which the inventory spoils and has no value. We will use the following assumptions. The average golf course sells 52.3% of all rounds on an average day for an average of $30.52 per round. Their capacity is 64,296 during a 9-month period, and therefore the course has approximately 234 rounds per day to sell. In addition, the author quotes operating expenses of $749,196 which amounts to approximately $2,725 per day.
Model 1: Commission Model
Assume that third-party sells only 5% of the course’s rounds on a particular day and pays a 10% commission per sale. On that day, the golf course takes in:
- 234 x 52.3% x $30.52 = $3,735
They pay a commission on 5% of the sold rounds or:
- $3,735 x 5% x 10% = $18.68
Thus, the day’s profitability is:
- $3,735 - $18.68 - $2,725 = $991.32
The course nets $991.32 for the day.
Model 2: Transaction Fee Model
Assume a base fee of $100 per month (or $3.33 per day) with a booking fee of $2 per round. They have the same revenue and pay:
- (234 x 52.3% x 5% X $2) + $3.33 = $12.24 + $3.33 = $15.57
Thus, the day’s profitability is:
- $3,735 - $15.57 - $2,725 = $994.43
The course nets $994.43 for the day.
Model 3: Barter Model
Assume that the golf course sells the same number of rounds as they do in Model 1 and Model 2. They have no variable outflow in this model and net:
- $3,735 - $2,725 = $1,010
The course nets $1,010 for the day; making the barter model the most profitable.
Let’s say one objects to the assumption that the number of sold rounds is not the same since the inventory at the beginning of the day is down 4 rounds. In order to buy into the author's mathematics, you would have to assume that two of those rounds would have been sold had they not been bartered away. This analysis requires more data than is available, but we can make some assumptions.
We approach it by analyzing two cases, one where the course is interfaced with bartering software, and where it is not.
Case I: The course is interfaced, so that the bartered tee time can be changed if it appears it will sell otherwise.
Here, the only way the barter will result in a loss of revenue is if the course sells out to 98.3% on a particular day (since the bartered tee-time only represents 1.7% of the inventory.) In order to calculate this probability, we would need to know not only the percentage of sold rounds in average, but the variance of sell-outs day-to-day.
Given that this percentage was calculated over 275 days, we calculate:
Therefore, the z-score for one particular day selling out over 98.3% is:
This represents a one-tailed probability under 0.000001. In other words, practically speaking this would happen infrequently. Therefore, the profitability calculation above would work. There may be the odd day where it happens, but on average, there would be no revenue lost.
Case II: The course is not interfaced, but selects its bartered tee time during spots that are not likely to sell.
Here, the barter will result in a loss of revenue if the tee time that hasn’t sold very often, suddenly sells. Instead of calculating the probability of being wrong, we will calculate the “sales threshold.” We define the “sales threshold” to be the percentage of times the tee time has sold over the last 9 months. The goal is to select a tee time under the “sales threshold” in order to breakeven with the best case scenario among the business models (Model 2) with an average daily cost of $15.57.
If p is the probability of selling a bartered round, then average lost revenue per round associated with a barter is:
- $32.52 x p
We need to add up the chances of selling one of the rounds, two of the rounds, three of the rounds, and potentially all four of the rounds. In addition, we want the sum of the lost revenue to be less than the cost of model 2, $15.57:
- $32.52 x P(1) + $61.04 x P(2) + $91.56 x P(3) + $122.08 x P(4) < $15.57
Where P(n) = the probability that n of the rounds would have sold during the bartered tee-time. This is:

If we solve this equation for p we find that p < 12.75%. We want to be 95% confident that we choose bartered tee-times that are less than 12.75% likely to sell. Using the Binomial Distribution, we find that we need to choose a tee time that has sold less than 8.8% of the time during the last 9 months. Our “sales threshold” is 8.8%. If we choose a tee time that has under our “sales threshold”, we are more profitable than the best competing model (Model 2).
Note that this calculation is overly conservative because it makes a strong assumption: if a bartered round would have sold, it could not have been sold at a different available time – in other words, you lost the business entirely. This certainly doesn’t happen often, and therefore, we believe the calculations from Case I are more appropriate. However, Case II forms a worst case scenario.
Faulty Application of Statistics in the Second Barter Calculation
As a side note, we want to address the second cost calculation the author makes in his article. He claims that a “Vegas-style” analysis of the cost would result in a $17,558 cost for bartered time. He comes to this number by asserting that there is a 52.3% chance of selling a round of golf.
This calculation is faulty in that it equates the percentage of rounds sold with the probability of a round selling. This is a common misconception among those not familiar with statistics, but it is incorrect. It assumes that all rounds sell with equal probability, which is clearly not the case. In addition, it ignores the variation of sold capacity over time. The actual probabilistic calculation is more involved, as we have shown above.
Faulty Profitability Analysis in the April 14th Email
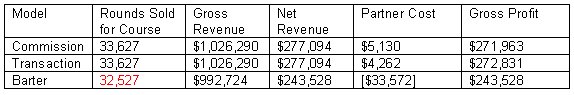
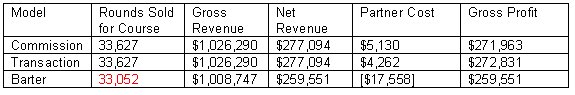
Finally, the author responds in an e-mail dated April 14th that he has considered the fixed cost aspects of his calculations appropriately. He does this by calculating the number of rounds sold under four scenarios:
- The commission business model sells 33,627 rounds in 9 months
- The transaction fee business model sells 33,627 rounds in 9 months
- The barter business model sells only 32,527 rounds in 9 months
- The barter business model sells only 33,057 rounds in 9 months
The author provides no evidence in his article nor in his e-mail that golf courses participating in barter business models sell fewer rounds of golf. Again, his assumption is that sold rounds are a fixed percentage of the inventory available for sale. The entire assumption is dubious. If, in fact, courses participating in barter business models sell on average the same number of rounds of golf than other courses, then the barter business models would have sold a higher percentage of the available inventory than the other two models.
If all courses sell approximately the same number of rounds of golf, then the author's calculations would result in the barter business model being more profitable, rather than the other way around.
Conclusion
There are two main conclusions from this analysis.
- The author's calculations do not appropriately reflect the “time-sensitive” nature of golf course inventory. A flat allocated cost model will overstate the value of unsold inventory, overstate the per-round profitability of sold rounds, and potentially lead courses to make bad business and pricing decisions.
- With the appropriate data and especially with interfaced software, golf courses participating in a bartered software system can easily be more profitable than courses participating in other third-party models. We believe the threshold to ensure profitability is quite low and achievable for most courses.
posted by GolfNowTV @ 9:28 AM
1 comments
![]()
![]()